This dashboard aims to answer the following questions:
- How have my organisation's Microcredentials performed over a time period as a whole?
- How does that performance compare to the same period in the previous period or year?
1.2 Microcredential Course Performance
This dashboard aims to answer the following questions:
- How are my individual microcredentials performing financially and in terms of engagement and reach?
- How is my microcredential performing compared to other microcredentials on the FutureLearn platform?
1.3 Microcredential Run Deep Dive
This dashboard aims to answer the following questions:
- How are my microcredential runs performing in terms of engagement and reach?
- How are my microcredential runs compared to other microcredential runs on the FutureLearn platform?
1.1 Microcredentials Overview
1.1.1 Filters
Date filter: A data filter that updates tiles on the date that the metric occurred, i.e. microcredential enrolments is filtered on the date that the enrolment was created by the user. Note: not all of the tiles in this dashboard are affected by the date filter
Compare vs: This is a dynamic filter which interacts with the timeframe selected in the date filter, and updates the % change on the single figure tiles (see below). The two options for this filter are “is Year on Year” or “is Period on Period”
- Year on year takes the selected date filter from date filter, and compares to the exact same period one year ago. So if the user selects March 2021 as their date filter, the “Compare vs.” filter would compare to March 2020
- Period on period is similar to year on year, except it compares against the same period as the date filter, but back to back. So if the user selects March 2021 as their date filter, the comparison would be against the previous whole month, February 2021
Country: This filters the data on the country of the users, based on their IP address at the time of enrolment
Is Microcredential Live Today?: This filters the dashboard to only view data on Microcredentials that are live (between their start and end date, in their learning period) on the day the user is viewing the dashboard

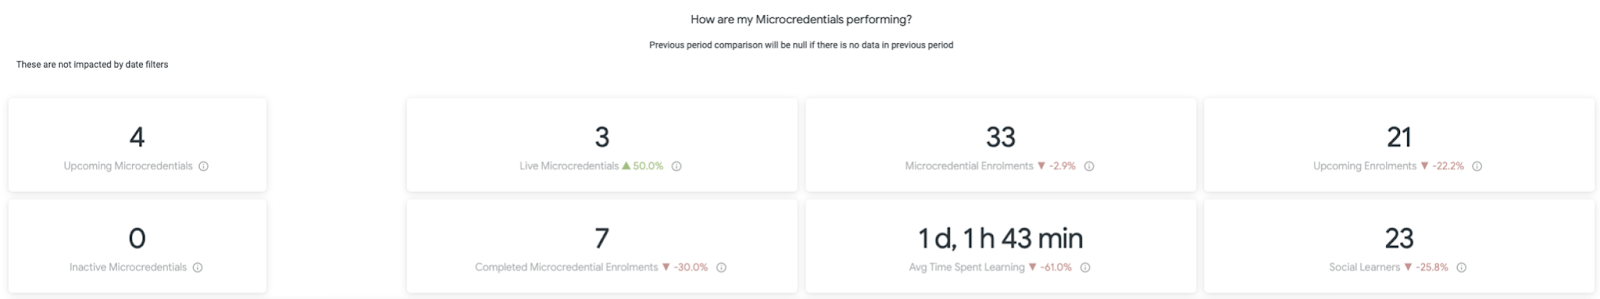
1.1.2 Top Line Metrics
Partners can view at a glance the main KPIs for Microcredential performance, aggregated for all of their Microcredentials. The tiles on the right show performance across the selected date filter, country, and live or not microcredentials, with the performance indicators comparing to either Year on Year or Period on Period, based on what was selected on the Compare vs. filter.
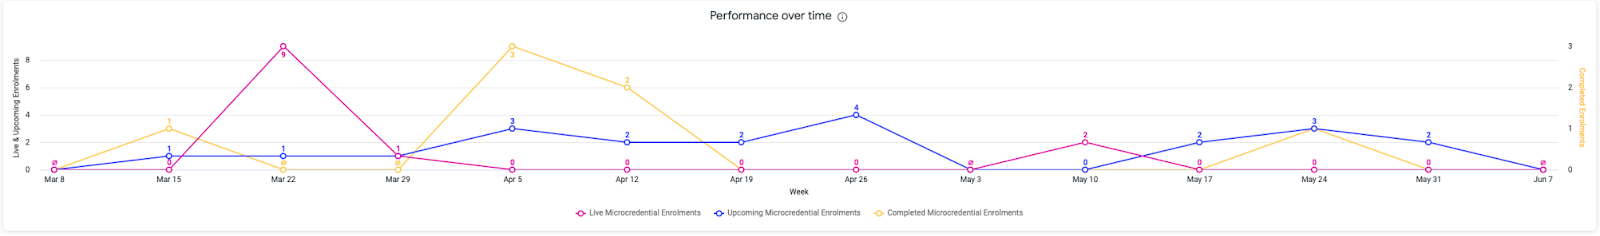
1.1.3 Performance over time
Partners can review their performance per week - live Microcredential enrolments, upcoming Microcredential enrolments, and completed microcredential enrolments for the determined time period. Microcredential enrolments are aggregated by the date of the enrolment, completed Microcredential enrolments are aggregated by the date of completion.
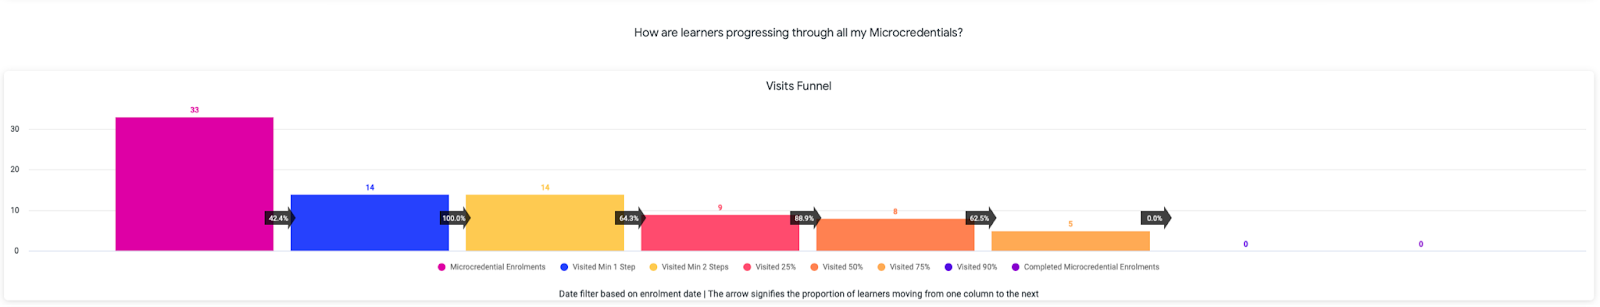
1.1.4 Visits funnel
The Microcredentials Visits Funnel shows granular data on the user journey throughout time. Partners can see how engaged learners are with their Microcredentials from the moment they start learning until completion.
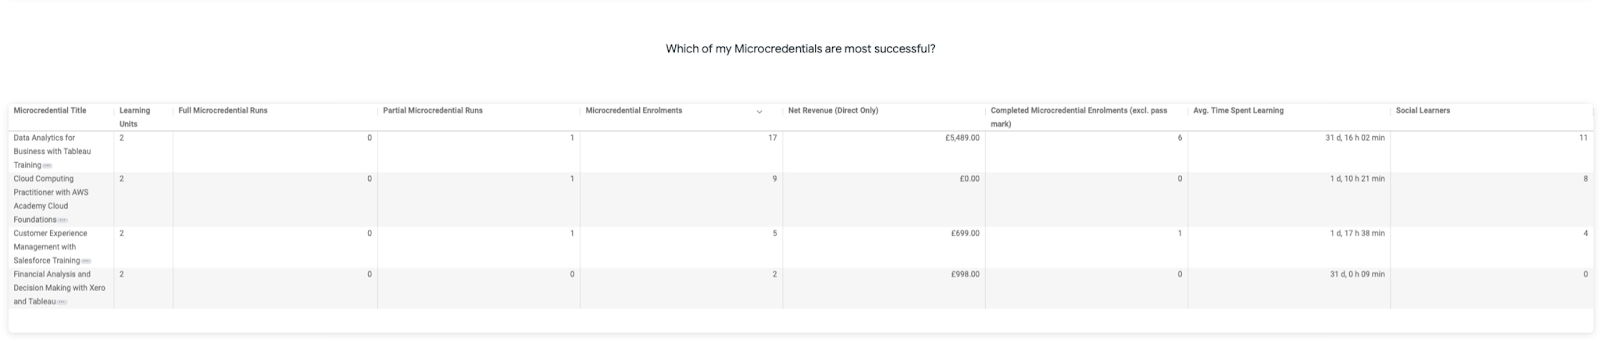
1.1.5 Microcredential Course Overview
This table provides a summary of topline performance, split by Microcredential. The data is determined by the data filter, where the enrolment metrics are filtered by the date of enrolment, and the revenue figures are filtered by the date of purchase. Partners can click on the table to order by different metrics.
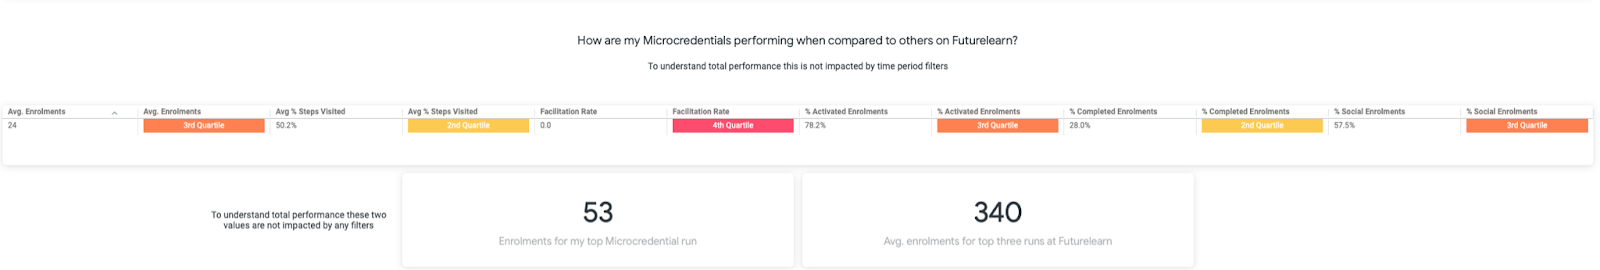
1.1.6 Microcredential Comparison
This table averages performance across all microcredential performance, irrespective of time. The date filter does not work for tiles in this section. Based on the average performance for all Microcredentials, the table allocates a quartile comparison against the averages for all Microcredential organisations across FutureLearn. In this example, this partner averages 24 enrolments across all of their Microcredentials, which puts them in the 3rd quartile (bottom 25-50% of all partners).
The bottom two tiles pull the enrolments for the partners top performing Microcredential, and provides a comparison to the average enrolments for the top three Microcredentials on FutureLearn.
1.1.7 Dormant Microcredentials Summary
This table is a topline summary of the partners Microcredentials where the last run has ended and there are no future runs scheduled in the next 6 months relative to when the user is viewing the dashboard.

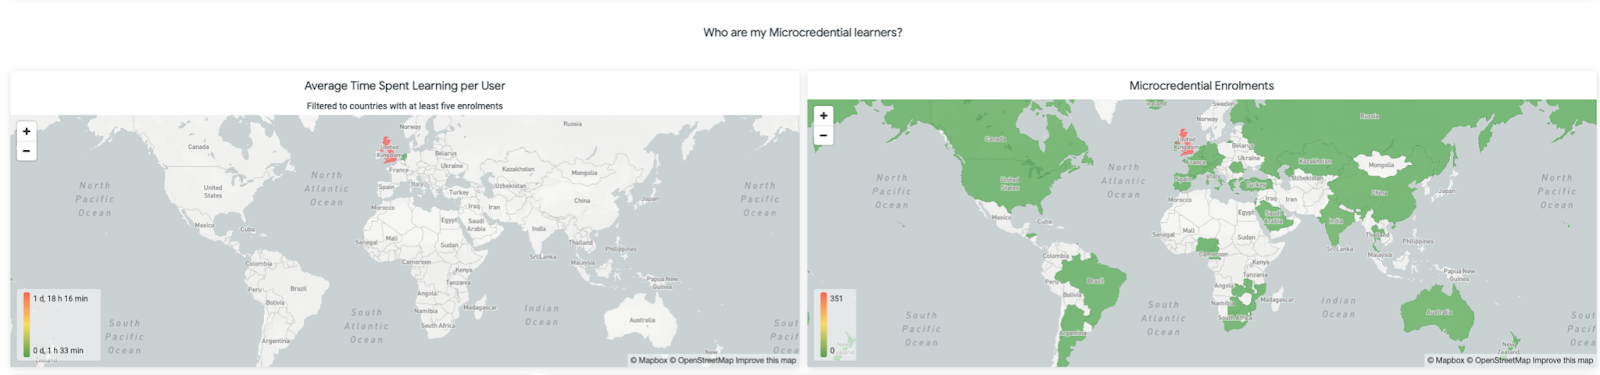
1.1.8 Microcredential Enrolments by Country
These tiles provide geographical information on the partners Microcredential learners, visualised as a heatmap. A learner’s country is determined by their IP address at the time of their enrolment. The average time spent learning chart is filtered to countries that have 5 or more learners
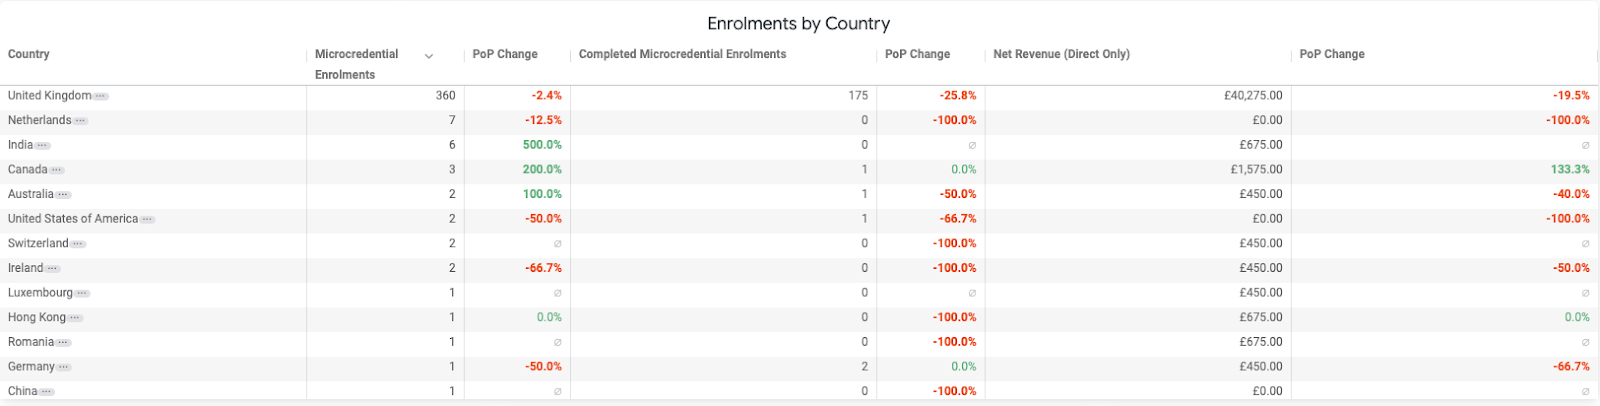
1.1.9 Microcredential Metrics by Country
Similar information is also available in table format, with the metrics also compared verses previous period or year on year, depending on the Compare vs. filter
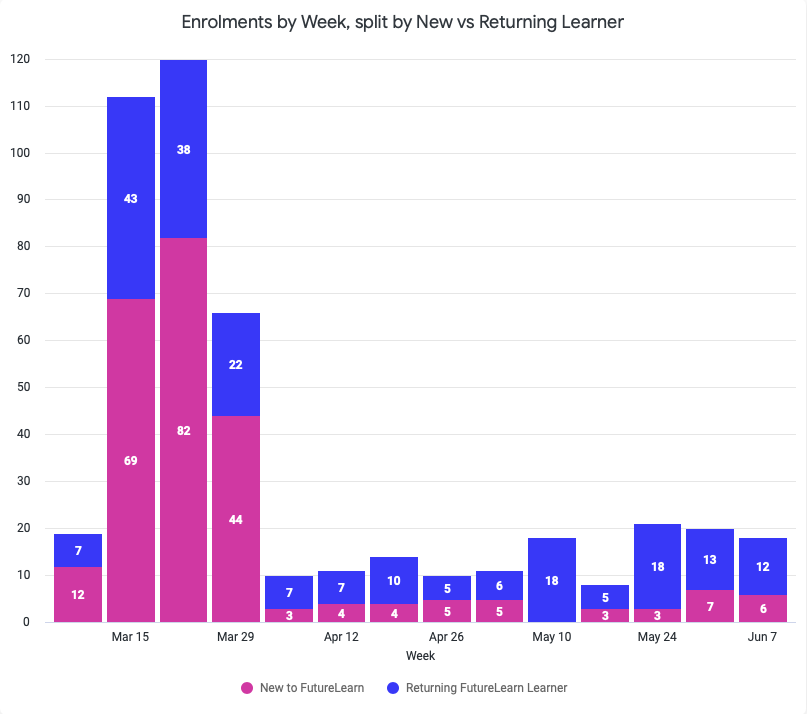
1.1.10 Enrolments by week, split by new vs returning learner
This table provides a week by week breakdown of Microcredential enrolments, aggregated by the date of the enrolment, split by new or returning learner. A new to FutureLearn learner is one that has had no prior enrolments on any FutureLearn content prior to their Microcredential enrolment
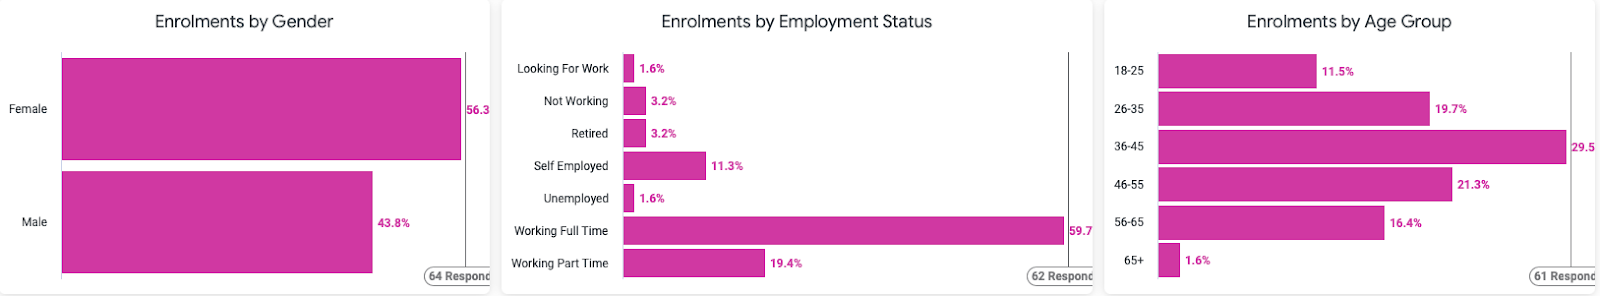
1.1.11 Demographic Information
Partners can view demographic information about all of the learners on their Microcredentials. This information is collected from an optional “More about you” survey, so not all of the learners have provided this data to share.
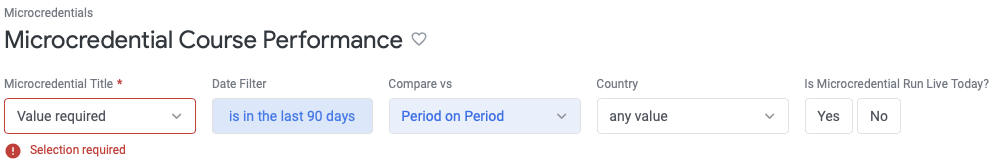
1.2 Microcredential Course Summary
1.2.1 Filters
This dashboard contains the same filters as Microcredentials Overview dashboard, with an additional Microcredential Course filter. This dashboard is designed to compare one Microcredential at a time, so the data will not load until a value is selected in this filter.
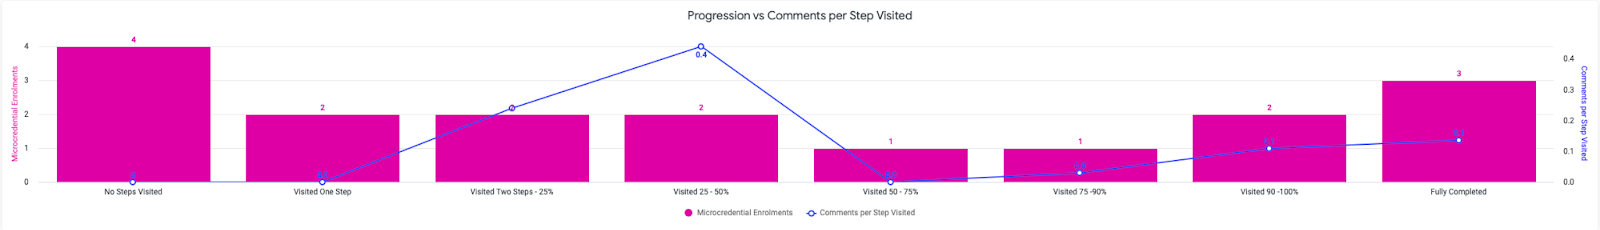
1.2.2 Progress vs. Comments per step visited
This chart expands on the visit funnel, counting each learner in the furthest progress quartile that they have reached. It also provides the comments per steps visited for the learners in each quartile. This is useful for analysing the progress of learners as a view of the whole Microcredential.
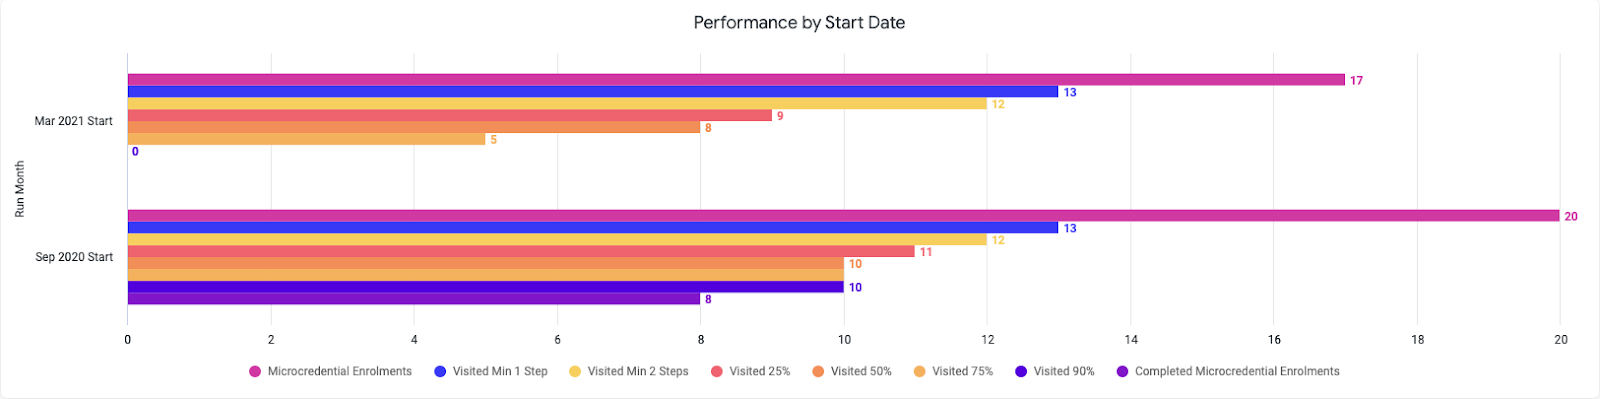
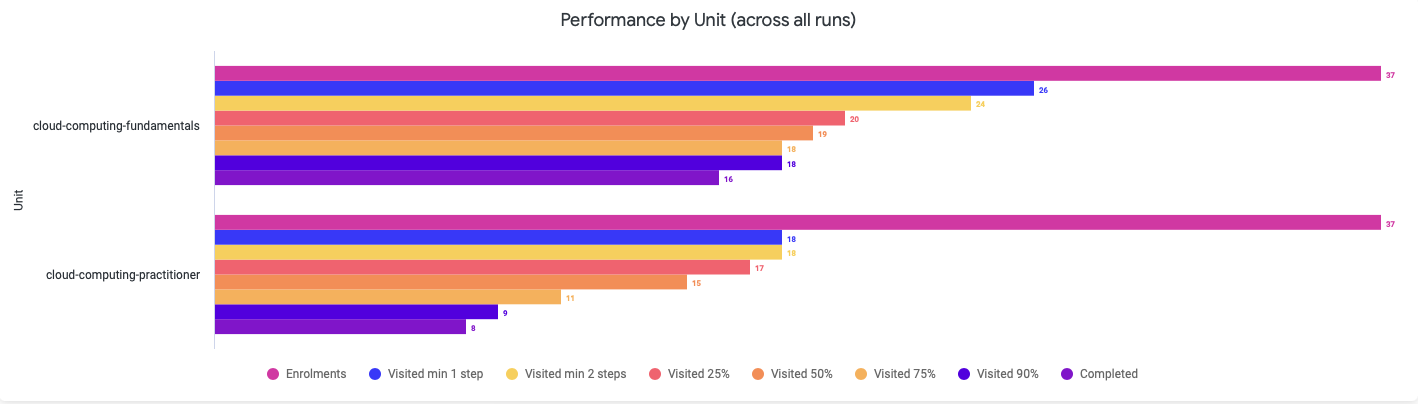
1.2.3 Performance by Unit & Performance by Start Date
Partners can view the same data as in the visits funnel, except split by unit and start date of the Microcredential. These charts are great for visualising the performance of different Microcredential runs and different units of learning in the Microcredential.
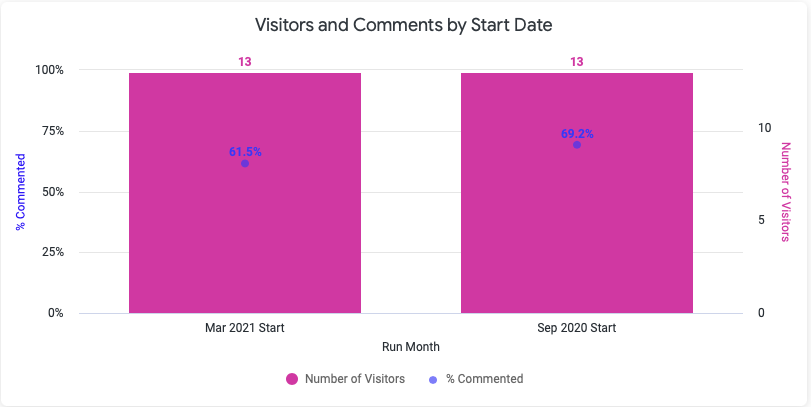
1.2.4 Visitors and Comments by Start Date
This chart shows how many unique visitors to steps there were on each Microcredential run, split by the month it started, and the % of those learners that left at least one comment.
1.2.5 Microcredential Run Summary Table
This table provides the top KPIs for the Microcredential, split by each run

1.3 Microcredential Run Deep Dive
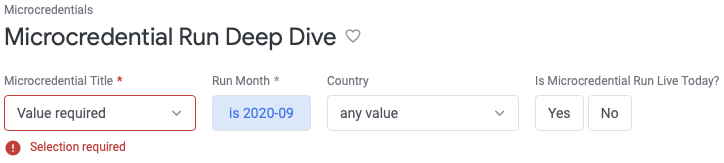
1.3.1 Filters
This dashboard is designed to review the performance of a single run of Microcredential course. So as before, the dashboard will not load until a Microcredential is chosen in the Microcredential Title filter.
The Run Month filter splits out the month that the Microcredential started its learning period, to distinguish between different runs.
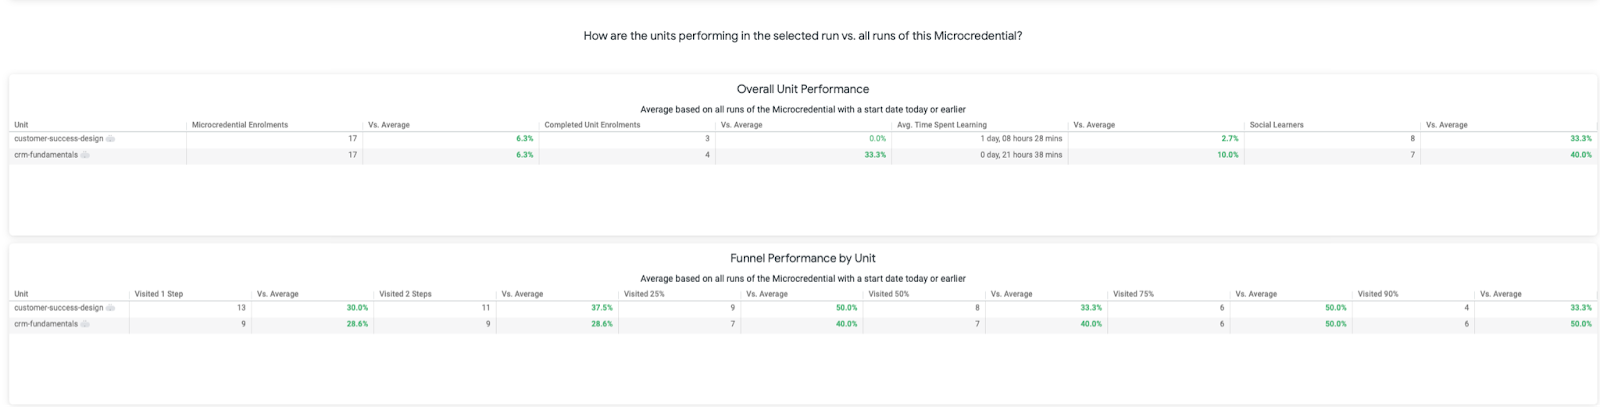
1.3.2 Microcredential Run Unit Performance
These are two inward facing charts that compare the top KPIs of the selected run of the Microcredential, against the average of all runs in the Microcredential. The criteria for selection in the average is all runs that started on or before the date of viewing.
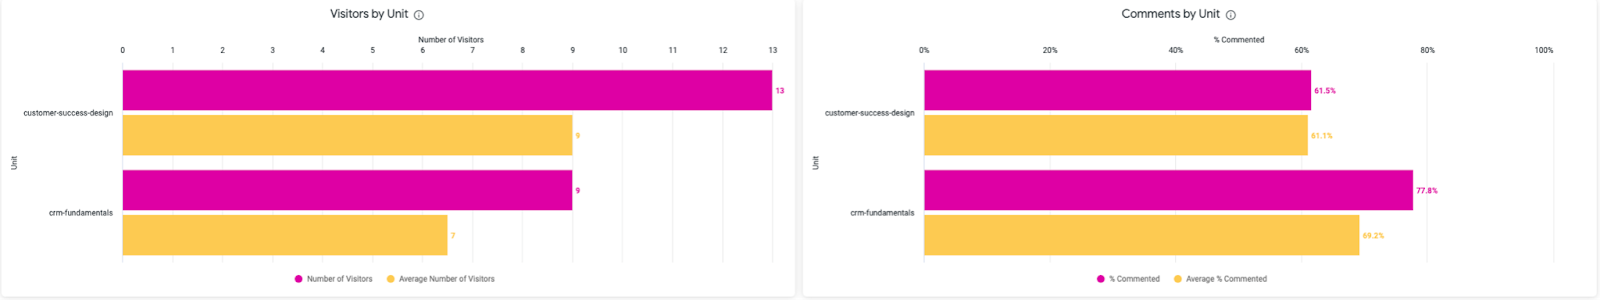
1.3.3 Visitors by Unit and Comments per Unit
Similar to the unit performance comparison, these charts are looking at visitors and % commented for the selected Microcredential run, and comparing them to the average of all the runs of the Microcredential.
Comments
0 comments
Please sign in to leave a comment.