This dashboard aims to answer the following questions:
- How have my organisation's short courses performed over a time period as a whole?
- How does that performance compare to the same period in the previous period or year?
This dashboard aims to answer the following questions:
- How are my courses performing in terms of engagement and reach?
- How are my courses performing compared to other courses in the same category on the FutureLearn platform?
This dashboard aims to answer the following questions:
- How are my individual course runs performing in terms of engagement and reach?
- Which steps are performing better in my runs?
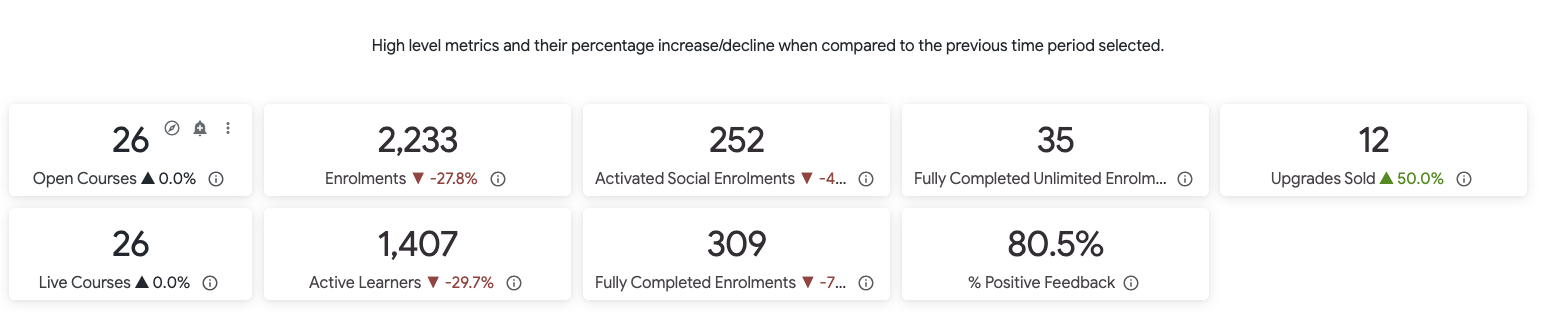
1.1 Partner Summary
1.1.1 Filters
Reporting Timeframe: A data filter that updates tiles on the date that the metric occurred, i.e. unit enrolments is filtered on the date that the enrolment was created by the user
Compare vs: This is a dynamic filter that interacts with the timeframe selected in the Reporting Timeframe filter, and updates the % change on the single figure tiles (see below). The two options for this filter are: “is Year on Year” or, “is Period on Period”.
- “Year on year” takes the selected date filter from Reporting Timeframe, and compares it to the exact same period one year ago. So if the user selects March 2021 as their Reporting Timeframe, the “Compare vs.” filter would compare to March 2020
- “Period on period” is similar to “year on year”, except it compares against the same period as the Reporting Timeframe, but back to back. So if the user selects March 2021 as their Reporting Timeframe, the comparison would be against the previous whole month, February 2021
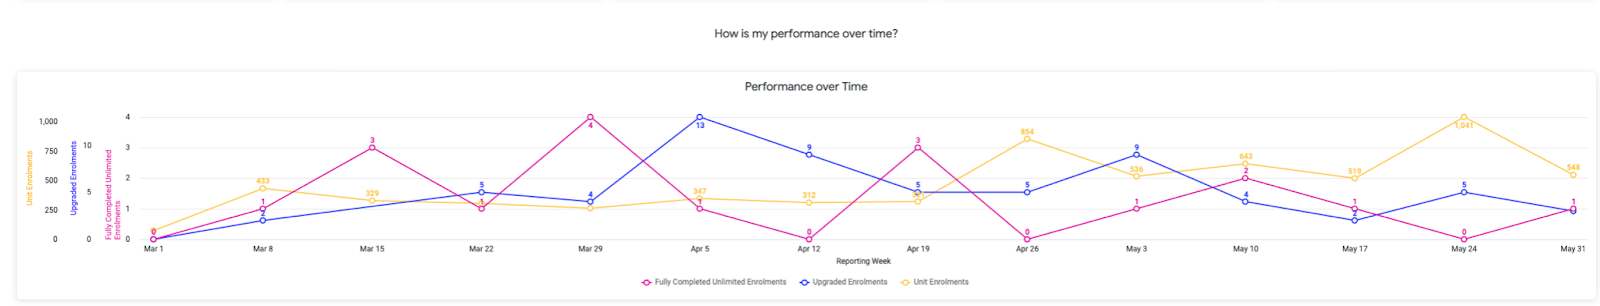
1.1.2 Performance over time
Partners can review their performance per week - unit enrolments, upgrades, and fully completed unlimited enrolments, for the determined time period.
1.1.3 Course Success
Partners can access information about courses that are open for enrolment in the selected time period. This report includes data of the course during the learning window (length of course in weeks) not the enrolment window.
The data shows which live courses are the most and the least successful in terms of enrolments and engagement (partners can use arrows at the top of each column to sort the data).
1.1.4 Understand Opportunities with Dormant Course Data
Partners can access information about Dormant Courses. Dormant Courses are courses that haven’t run in the last six months and are not scheduled to run in the next six months. This information showcases opportunities partners have in terms of increasing revenue and brand awareness among potential learners if running these courses more frequently.
The number of students who wishlisted a dormant course is also shown.
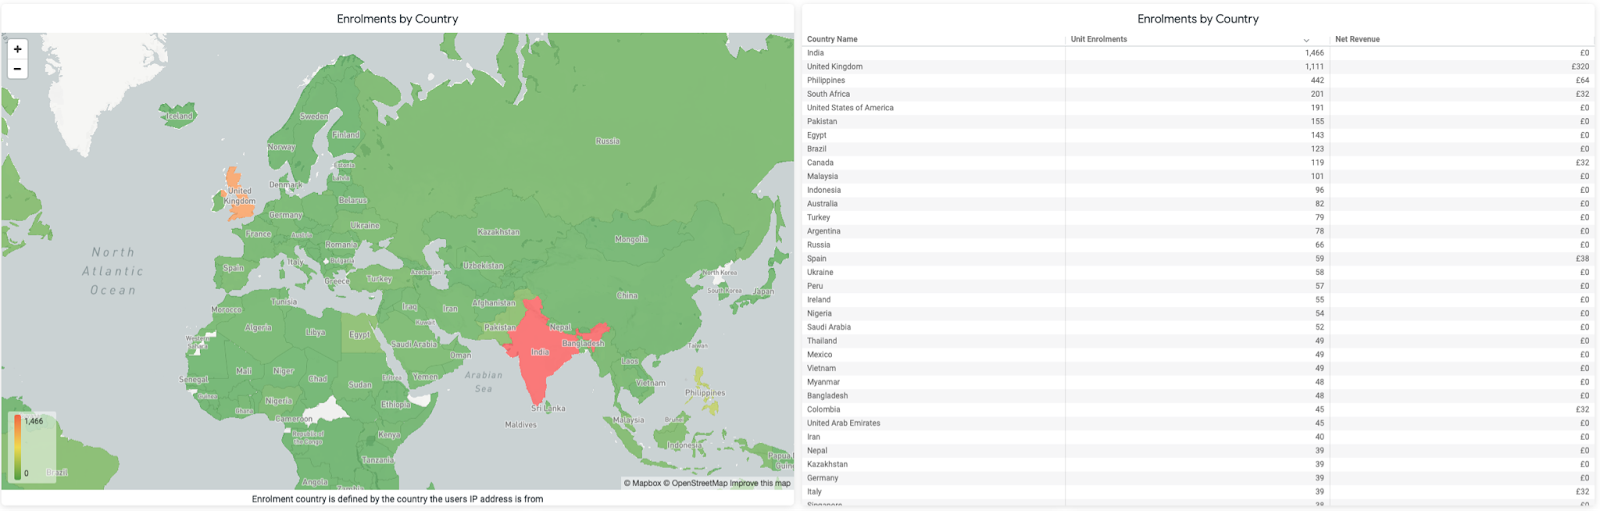
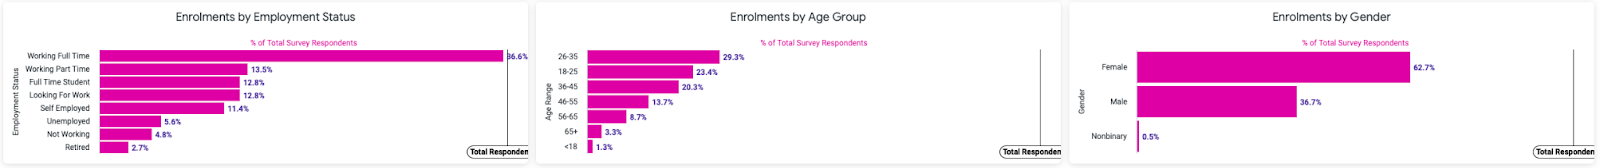
1.1.5 Who are my learners?
Partners can view demographic and socio-economic data on learners, including learner’s gender, employment status, age group and geography and purchasing behaviour based on demographics. This data is taken from end of course surveys and learners’ IP addresses.
This data can help when creating strategies to target learners to enrol in further courses, including on-campus offers and structuring future course content.
1.2 Course Overview
1.2.1 Filters
Select Course: This filter finds all of the listed short courses course slugs at the partner’s organisation. The partner can select multiple courses at once. Course slug is used because it is the unique identifier for each short course.
1.2.2 Category Performance
Partners will be able to see information on how their courses are performing with the ability to select one or multiple courses for analysis.
Benchmarking shows a course’s performance against FutureLearn-wide performance for courses in the same category.
A course can fall into one of four quartiles when compared to other courses on the platform, which shows that course’s performance against what is expected. Please note: we use quartiles and not averages when benchmarking.
Partners can also analyse if learners are more or less engaged with their courses than they are with other courses available on the platform in the same category.
1.2.3 Course Visits Funnel
Engaging content is key to keeping learners interested, inspired, and committed to being active during their studies and finishing the course.
The Course Visits Funnel shows granular data on the user journey throughout time. Partners can see how engaged learners are with a course from the moment they enrol until completion.
Partners can also access learner activity in each step of the course by using this report. If learners are abruptly leaving a course at certain steps, partners can analyse the patterns, or differences between steps to help them understand if any parts of the course are getting a disproportionate number of drop-offs and need to be revised or reviewed.
(Note: some drop-off is normal and certain step types can see higher rates, such as Tests or Peer Review.)
1.2.4 Course Performance by Run
Partners will access information on how many new learners they are getting on each run, and which runs are more popular than others in terms of enrolments, engagement and completion.
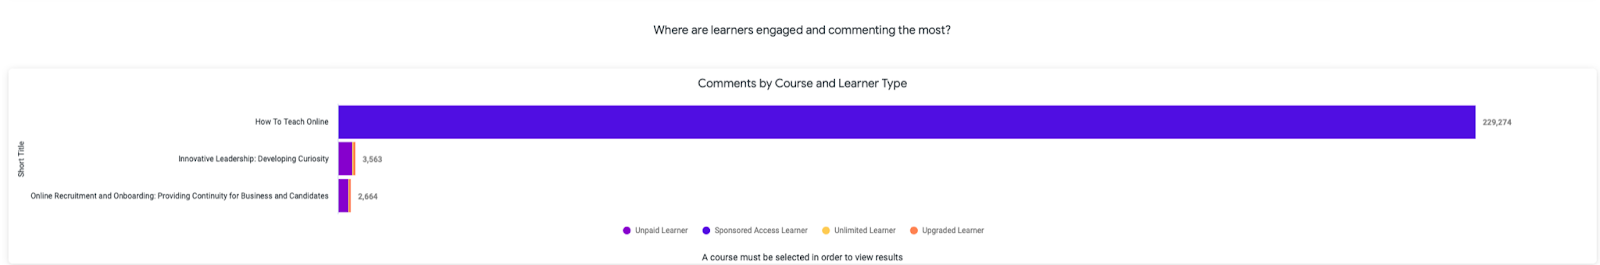
1.2.5 Comment Performance by Course
Partners will access information on how many comments they get on each course, split by what type of learner made the comment.
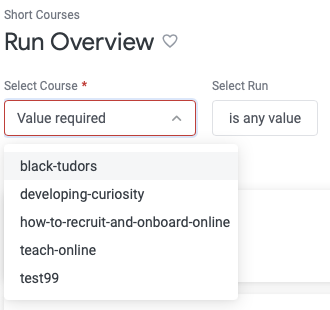
1.3 Run Overview
1.3.1 Filters
The Run Overview dashboards are designed to limit the data to one course only. Therefore only one course can be selected from the Select Course filter, and the dashboards will not load until a course is selected. The partner can then choose to filter based on specific runs of the course.
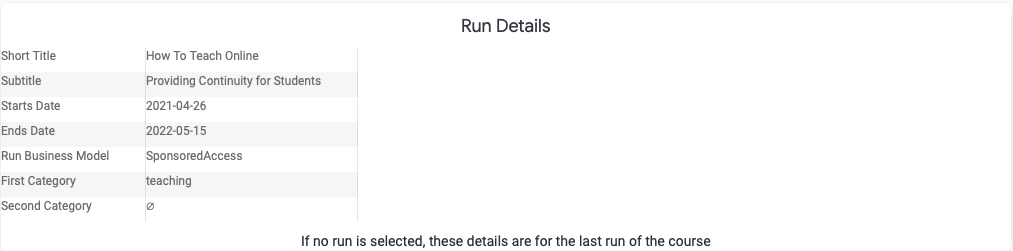
1.3.2 Run Details
Partners can view a brief table of the run times, categories, and business model of the selected run(s).
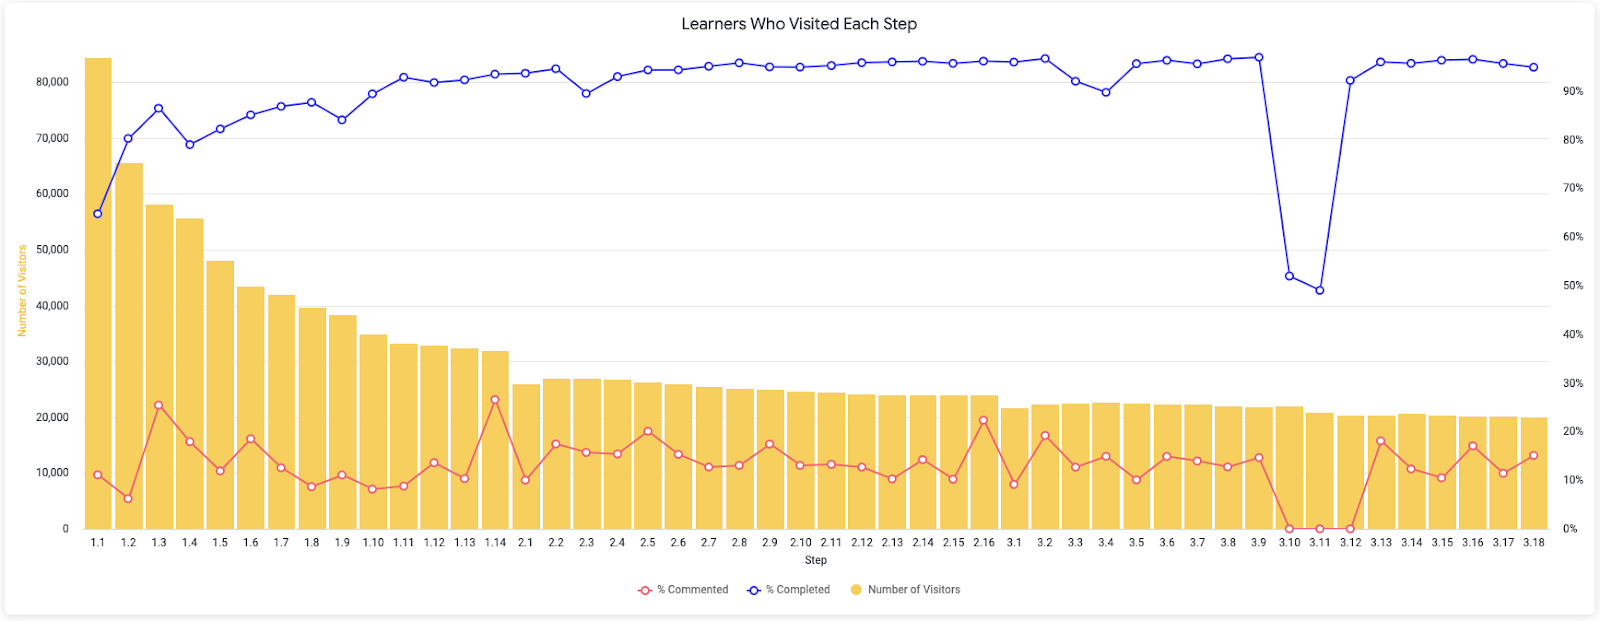
1.3.3 Step by Step Performance
Partners can review their learners' progression through a Course Run from enrolment to course completion. This also includes how many learners viewed, commented & completed steps.
1.3.4 Visitors and commenters per run week
Split by the weeks of content in a run, partners can view how many learners have visited each week, and what % of those have commented on at least one of the steps.
Comments
0 comments
Please sign in to leave a comment.